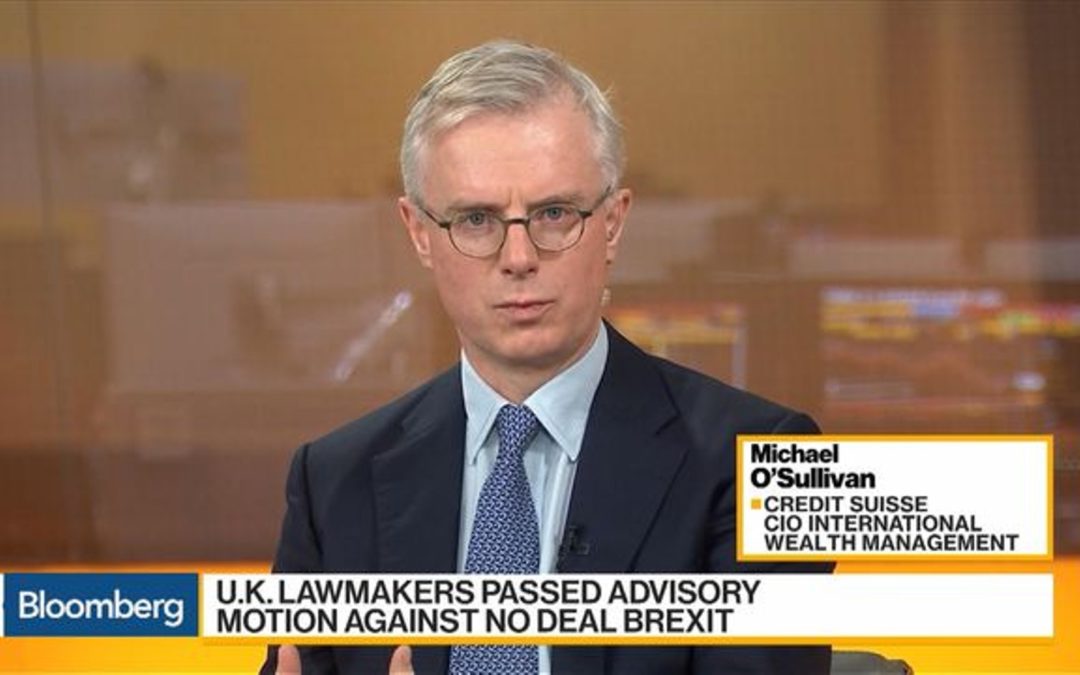
Michael O’Sullivan, the Chief Investment Officer of the International Wealth Management Division at Credit Suisse, is one of the smartest people I know on global macro issues and the intersection of markets, geopolitics, and the global economy. He also has a bent for history, and his weekly letters to clients and friends (my bank account puts me in the latter category) is always a great tour d’horizon of the issues, big and small, shaping markets.
I asked him if I could republish his most recent letter, sent on March 3. The bold and italics marks are mine. See below:
In 1900 the UK stock market made up 25% of the world market, the US accounted for 15%, Russia made up 6.3%, Austria nearly 6%, and South Africa 3.3%. From then, the rise and fall of nations has left its mark on financial markets. Austria no longer has an empire and is a financial minnow now, while the 1917 Revolution in Russia saw its stock market expire and only make a comeback in the 1990s. The 20th century has been the American century and its share of the world stock market is 53% today. In 1900 Japan was a frontier market, whose later boom saw it swell to the high teens in terms of stock market size. It now accounts for 8% of the world market.
Similarly, only a decade or so ago China was a stock market fledgling, today it represents 3.4% of the world equity market. The accelerated inclusion of Chinese stocks in the MSCI emerging markets benchmark will provide a channel for China’s share of financial markets to increase, and relative to its GDP, there is much room for growth. My own sense is that once China’s necessary phase of deleveraging is over (it could take over five years), it will begin to deepen its financial markets and the elaboration of this financial infrastructure will be one of the most exciting periods in finance in the next ten years.
What about the UK? Today its internationally oriented stock market is only 5.3% of world markets, down from the 25% mentioned earlier. Similarly in 1900, one pound was worth close to 5 US dollars, a somewhat more impressive exchange rate than today’s 1.33. Readers of David Kynaston’s excellent books on the City of London will get a flavor of how economically powerful the UK was at the turn of the 20th century, and how vital London was as a global financial center. This has changed. Brexit, which I do feel is a response to relative economic and geopolitical decline, is expected by many to further curb the power of the City.
Some solace may however be at hand as we now have a degree of clarity on the path Brexit could follow in coming weeks. On last Monday we issued an Investment Alert on Brexit, which, because events were evolving rapidly, I had to revise three times. Essentially, the legal and parliamentary procedural channels at Westminster provide for an extension of Article 50 if the UK Prime Minister’s deal is not voted through in mid-March. Politically, the risk that the Brexiteers might miss the Brexit train, and the opening up of the political center creates a set of incentives that could well lead to a deal.
The road toward a deal also depends on the guidance of the UK Attorney General around the backstop and the ways in which the government begins to frame the future relationship between the UK and the European Union. Sterling’s latest leg higher underpins the sense that a chaotic no-deal Brexit is now much less likely, and we maintain our constructive view on the GBP.
Moving on from Brexit, the reason for starting this week’s note with financial market history is that last week we launched our 11th CS Global Investment Returns Yearbook (more on the Yearbook in a subsequent post). My Credit Suisse Research Institute colleague Richard Kersley remarked that in the context of recent market volatility, the long run analysis of stock market history is a good guide to understanding the future. One such example is emerging market equities, which since 1950 have outperformed developed market equities by just over 1% per year.
Emerging markets (EM) are still growing up in terms of their market structure in the sense that hard to access stocks (like China A-shares until recently), free float restrictions and often poor liquidity have meant that a broad range of investors have often found it hard to replicate EM growth in portfolios. Still from a portfolio point of view, one point the Yearbook makes is that the relative volatility of emerging markets has fallen in recent years (perhaps because developed countries are themselves more shaky), and the relatively low correlation between emerging and US market equities means that EM offers a source of broad diversification.
One area where the research in the Yearbook, running back through the past 119 years, is inconclusive is whether poor years in the equity market are followed by good ones. This is often the case for emerging markets but for larger developed markets we don’t see a “positive serial correlation,” as academics might put it.
As we now head into March, the global rebound of the past two months has been extraordinary, and reassuring to the degree that it signals a slowdown rather than a breakdown in the economic cycle. There are other issues to worry about, however, which we have flagged in this note in recent weeks, including record high debt levels, a shaky market micro-structure, the need to leave Quantitative Easing behind and generally poor productivity. I have not mentioned geopolitics and policy volatility, to which markets have become inured. So, as markets have moved energetically higher, we prefer to strike a more circumspect, prudent tone and maintain our neutral view on global equities.


