Two Middle East Companies Among Top 100 US Exporters, Importers
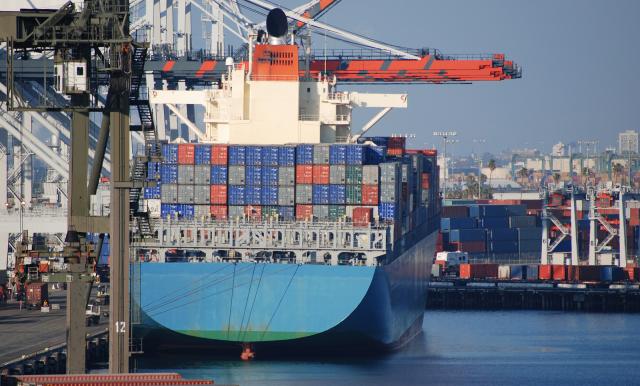
Every year, the Journal of Commerce, the world’s leading publication on global shipping and logistics, publishes its Top 100 U.S Importers and Exporters (paywall) guide. It’s a great insider look at U.S trade and globalization from the company level. It measures imports and exports as expressed in container ship volumes – through which the vast majority of global trade is conducted. It should come as no surprise that Wal-Mart took the crown as America’s largest importer, though it may surprise you to know that Koch Industries, the Wichita-based conglomerate, is America’s top exporter of goods via container ship.
Deep into the standings, I was struck by two companies headquartered in the Middle East that made the list: Almarai and Dubal.
Riyadh, Saudi Arabia-based Almarai came in at #77 on the Top 100 Exporters list. Anyone who has spent time in Saudi Arabia knows Almarai. It’s the leading dairy producer and a major foodstuffs exporter across the Middle East and South Asia. National Geographic Television even did a documentary about Almarai’s massive dairy mega-factory.
But what was Almarai doing in the Journal of Commerce U.S Exporters list?
So I did a bit of digging, and it seems that its recent purchases of farmland in California and Arizona has begun to pay off with large-scale alfalfa production. Alfalfa is hard to grow in Saudi Arabia’s climate, and the government grew tired of subsidizing the crop for major dairy producers like Almarai, so they told companies like Almarai to go out and find their own alfalfa. That’s when Almarai went out and bought some US farmland. This article in the Guardian outlines some of the controversies, challenges, and opportunities of Almarai’s investments.
So, Almarai buys farmland in the U.S, grows alfalfa hay in large quantities, packs them into shipping containers for the long journey to Red Sea ports in western Saudi Arabia and feeds the bale to cows on Almarai dairy farms. How’s that for global supply chains? More on this story later.
The second company that caught my eye was Dubal America. They ranked as #72 on the Top 100 importers list. Dubal America is, according to its website, a “wholly owned subsidiary of Dubai Aluminium PJSC (“DUBAL”) and a member of the Emirates Global Aluminium (“EGA”) group of companies. DAI is the sole distributor of the aluminium products manufactured by Dubal and Emirates Aluminium Company Limited PJSC (“EMAL”) in North America.”
It’s worth noting that Emirates Global Aluminum is owned equally by Abu Dhabi-based Mubadala and Investment Corporation of Dubai, and represents a rare example of Abu Dhabi Inc. joining hands with Dubai Inc. to consolidate and build a better global company than the separate entities that existed before the merger.
Emirates Global Aluminum is the sixth largest aluminum producer in the world, and sources a good deal of its bauxite — the aluminum raw feeder — from sub-Saharan Africa. They have invested in a $1.4 billion bauxite project, administered by the Guinea Aluminum Corporation, wholly owned by EGA.
So, again, a story of our global supply chains – bauxite from Africa to the UAE, processed and refined into aluminum ingots, and sent to the United States to be sold to companies ranging from the aerospace to the food industry. More on this later too.
In fact, Dubal America imports more container ship volumes into the United States than — are you ready for this? — Starbucks.
Red Sea Economies – By The Numbers
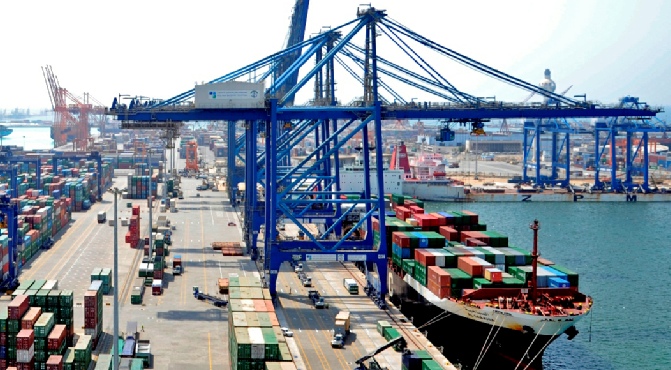
Photo: Red Sea Gateway Terminal at Jeddah Islamic Port
Red Sea Economies/Population and Exports at a Glance
| Country | Population | GDP | Top Export Destination |
| Saudi Arabia | 32.3 M | $782.4 B | China |
| Egypt | 95.7 M | $245.6 B | Italy |
| Sudan | 39.6 M | $33.9 B | UAE |
| Yemen | 27.6M | $26.9 B | China |
| Eritrea | 4.96 M | $6.721 B | Ethiopia |
| Djibouti | 942,333 | $2.1 B | Egypt |
| TOTAL | 201.1 M | $1.097 Trillion |
Top Ten China Crude Oil Suppliers 2018
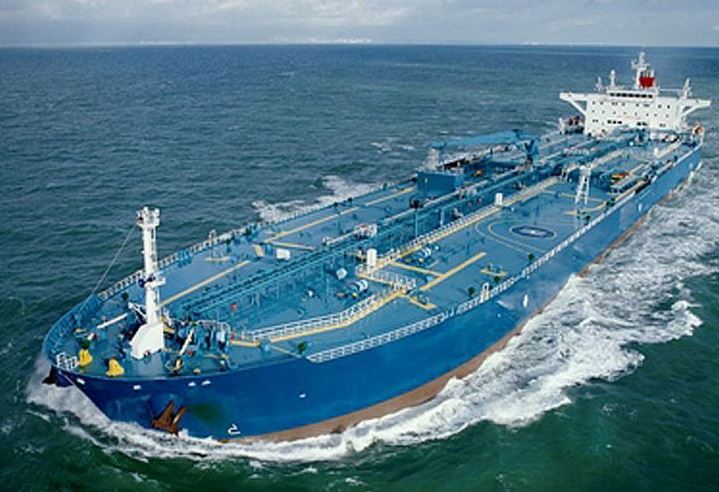
In our latest Top Ten List, we look at the Top Ten Crude Suppliers to China for 2018. The United States sneaked in at the number ten spot this year, and would likely have ticked upward in 2019 were it not for the US-China trade war. For more on U.S petroleum, see the United States of Petroleum
Here’s the Top Ten List with the percentage of market share, with thanks to WorldsTopExports.com
China’s Top Ten Crude Oil Suppliers and Their Market Share
- Russia – 15.8%
- Saudi Arabia – 12.4%
- Angola – 10.4%
- Iraq – 9.4%
- Oman – 7.2%
- Brazil – 6.8%
- Iran – 6.3%
- Kuwait – 5%
- Venezuela – 2.9%
- USA – 2.8%
(The UAE comes in at #11, also with 2.8% of market share)
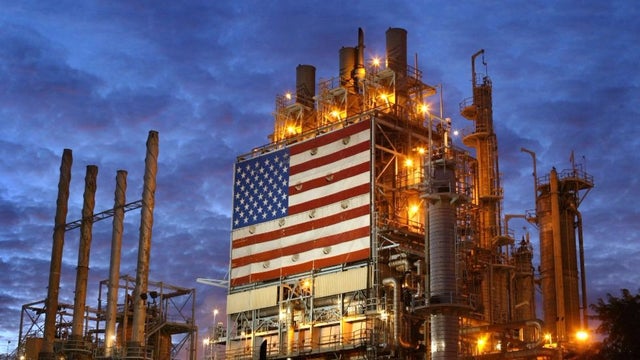
The United States of Petroleum
The United States quietly surpassed Saudi Arabia and Russia in 2018 as the world’s largest crude oil producer, according to the Energy Information Administration. If you count all petroleum liquids, the U.S is by far the world’s largest producer. This table below, from the EIA, gives you a sense of U.S primacy in petroleum production.
The 10 largest oil1 producers and share of total world oil production2 in 20183
| Country | Million barrels per day | Share of world total |
| United States | 17.87 | 18% |
| Saudi Arabia | 12.42 | 12% |
| Russia | 11.40 | 11% |
| Canada | 5.27 | 5% |
| China | 4.82 | 5% |
| Iraq | 4.62 | 5% |
| Iran | 4.47 | 4% |
| United Arab Emirates | 3.79 | 4% |
| Brazil | 3.43 | 3% |
| Kuwait | 2.87 | 3% |
| Total top 10 | 70.96 | 70% |
| World total | 100.66 |
1 Oil includes crude oil, all other petroleum liquids, and biofuels.
2 Production includes domestic production of crude oil, all other petroleum liquids, biofuels, and refinery processing gain.
3 Most recent year for which data are available when this FAQ was updated.
For the link to the EIA site where this table was found, go here.
U.S Oil and Gas By the Numbers
12.1 million barrels/day – Estimated 2019 crude oil production in the United States
12.9 million barrels/day – Estimated 2020 production
90.2 billion cubic feet/day – Estimated U.S natural gas production in 2019
92.2 billion cubic feet/day – Estimated U.S natural gas production in 2020
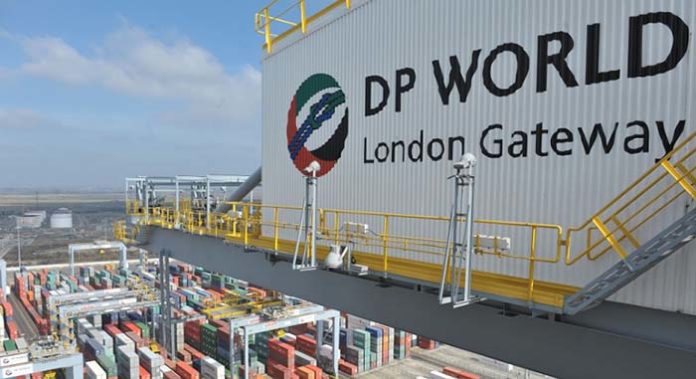
DP World Primer
DP World Primer – By Afshin Molavi (Part of the Dubai Silk Road Series)
Dubai-headquartered DP World is the world’s fifth largest container terminal network operator, handling 71.4 million twenty foot equivalent units (TEUs) last year at 78 marine and inland terminals across 6 continents. Founded in 2005 by merging the Dubai Ports Authority and Dubai Ports International, DP World has become a major trade enabler across emerging markets. According to DP World, some 75% of their trade volume flows through emerging/frontier markets.
It is also the only listed major port operator, listed on the Dubai International Financial Exchange in 2007.
Here’s a world map of their operations.
These are the Top 5 container port operators worldwide, according to Lloyd’s List, with DP World coming in at number 4 due to a recent purchase of European container ship operator, Unifeeder.
| Terminal Operator | HQ | Annual TEU (2018) |
| COSCO Shipping Ports | China | 117.36 Million |
| Hutchison Port Holdings | Hong Kong | 84.6 Million |
| PSA International | Singapore | 81 Million |
| DP World | Dubai | 71.4 Million |
| China Merchant Port Holdings | HK Subsdiary of China HQ | 80.73 Million |
TEU’s compiled by Afshin Molavi from public data. Order above based on Lloyd’s List; TEU’s not the sole criterion.
According to my calculations, these five port operators handle about half of the world’s containerized trade.
DP World’s flagship operation is located in Jebel Ali, in the United Arab Emirates. The Jebel Ali port is the ninth busiest container terminal port in the world. Here’s a cool visual on the biggest container ports in the world.
DP World in Africa
DP World operates, develops and manages 7 marine and inland terminals in Africa. They include Senegal’s busiest container terminal as well as DP World Maputo, three berths on the Suez port of Sokhna, Egypt, an inland logistics facility in Rwanda, as well as facilities in Algeria, and a new facility in Berbera, Somaliland.
The company was recently awarded more than $500 million by a London court arbitrating its dispute with Djibouti over the managing and developing of the Doraleh Container Terminal. Quartz Africa has a good piece on the background and the business and geo-strategic elements of the conflict between DP World and Djibouti, and the tussle between DP World and China Merchant Port Holdings. The tussle, however, has done nothing to dent the dramatically rising commercial relationship between China and the UAE.
In a press release issued on February 5, 2019, Group Chairman and CEO Sultan Ahmad bin Sulayem, said “performance in Africa remains robust driven by Dakar (Senegal) and Sokhna (Egypt).”
Timeline of Key Events – DP World
- 1972 – Port Rashid is launched with 11 berths; This begins Dubai’s journey as a sea trade hub for the region
- 1976 – Ruler of Dubai launches Jebel Ali Port construction, x miles away from Port Rashid; At the time, many saw it as white elephant and unnecessary given the recent launch of Port Rashid. According to accounts at the time, some merchants even tried to get him to stop it.
- 1979 – Jebel Ali completed, and it begins attracting major industrial players to set up business just outside the port
- 1991 – Dubai Ports Authority is created to merge Port Rashid with Jebel Ali under one authority. By this time, traffic to Jebel Ali had been rising dramatically, and the two ports combined went over the one million TEU mark.
- 1999-2004 – Dubai Ports goes international with the formation of a company to manage and operate container terminals outside the UAE; over the next few years, the newly formed entity, Dubai Ports International FZE, wins contracts in Djibouti, India, Romania, and Saudi Arabia
- 2005 – DP World is officially established by merging Dubai Ports Authority and Dubai Ports International.
- 2005 – DP World acquires CSX World Terminals, one of the world’s largest terminal operators, catapulting DP World into the “Premier League” of terminal operators
- 2006 – DP World purchases Peninsular and Oriental Steam Navigation Company, P&O Maritime, increasing dramatically its global network.
- 2007 – DP World listed on Dubai International Financial Exchange (DIFX) in what was at the time the largest IPO in the region, valued at $4.96 billion dollars.
- 2008-9 – Major acquisitions and operating contracts won include Brazil’s EmbraPort as well as ports in Netherlands, Algeria, Spain and Peru
- 2013-17 – Acquired Prince Rupert Container Terminal (Canada), Won 30 year concession for Port of Berbera (Somaliland); Consoidated Santos Brazil with 100% ownership
- 2018-19 – Investment with National India Infrastructure Fund to invest up to $3 billion across the country; 30 year concession for port in Banana, DRC; 100% acquisition of Unifeeder Group, largest container feeder and shortsea network operator in Europe
Sources: Most of the timeline information above comes from DP World.
Now, if you really want a deep dive on DP World, I found this presentation online that they gave to investors in May 2019.
The 10 Largest Construction Projects in the World
The largest construction project in the world is — no surprise — the massive new air hub planned in Dubai, Al Maktoum International Airport. Here’s a list of the Top Ten, courtesy of The Balance
- Al Maktoum International Airport, Dubai
- Jubail II, Saudi Arabia
- DubaiLand, Dubai
- International Space Station, Space
- South-North Water Transfer Project, China
- London Crossrail Project
- High Speed Railway, California
- Chuo Shinkansen (High Speed Railway), Japan
- Beijing Airport, China
- Great Man Made River Project, Libya
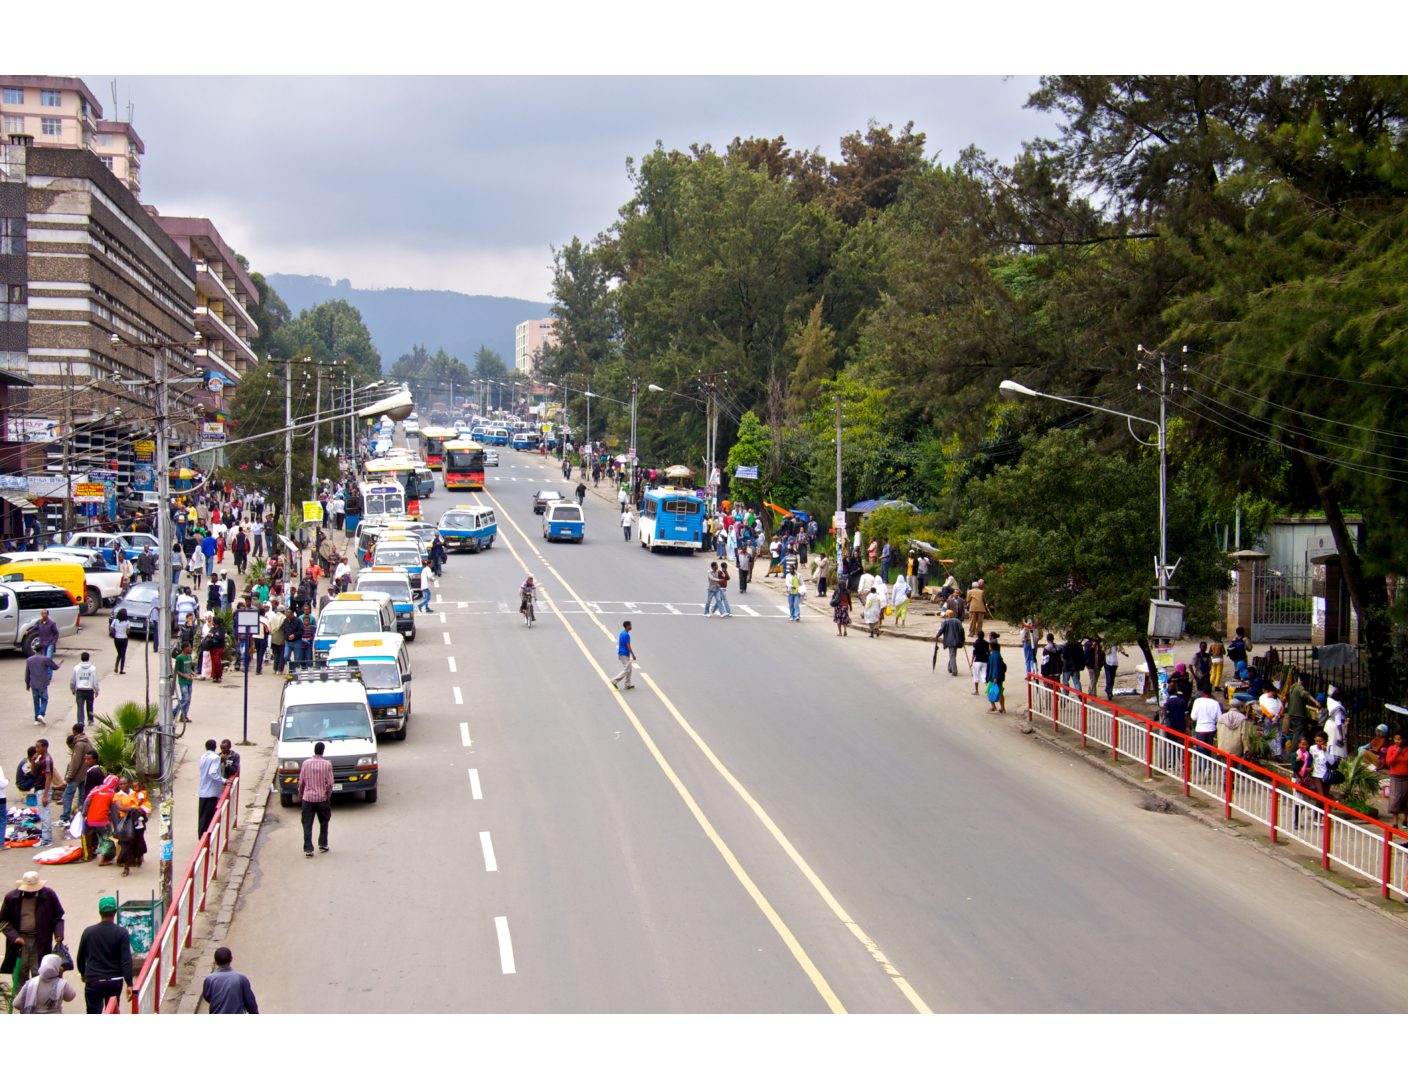
The Top Ten Fastest Growing Economies for 2019
Photo: A view from King George VI Street at Arat Kilo District, Addis Ababa, capital of the the third fastest-growing economy in the world.
The IMF has just published its latest World Economic Outlook, including a downward revision to its earlier global growth forecasts for 2019 to 3.3%.
So, where is the fast growth coming from? Africa mostly, but also South and Southeast Asia.
Here are the Top Ten fastest (forecast) growth economies for 2019 as tabulated by the New Silk Road Monitor from the IMF WEO report (Note: there’s more than 10 because of a few ties)
The Top Ten Fastest Growing Economies – 2019
- Ghana, South Sudan Tie – 8.8%
- Rwanda – 7.8%
- Ethiopia – 7.7%
- Cote D’Ivoire – 7.5%
- India, Bangladesh Tie – 7.3%
- Senegal – 6.9%
- Cambodia – 6.8%
- Lao PDR, Djibouti Tie – 6.7%
- Nepal, Philippines, Vietnam, Benin, Niger Tie – 6.5%
- Mauritania, Myanmar Tie – 6.4%
The Next Ten (11-20) Fastest Growing Economies – 2019
- China, Turkmenistan, Uganda Tie – 6.3%
- Burkina Faso, Panama Tie – 6.0%
- Guinea – 5.9%
- Kenya – 5.8%
- Egypt – 5.5%
- Republic of Congo – 5.4%
- Indonesia, Malta Tie – 5.2
- Dominican Republic – 5.1%
- Central African Rep, Togo, Tajikistan, Guinea Bissau, Timor Leste, Mali – 5%
- Bhutan – 4.8%
Note: Countries with population under 100,000 people not included here. This excludes the island nation of Dominica, expected to post 8% growth, and Cabo Verde at 5%.
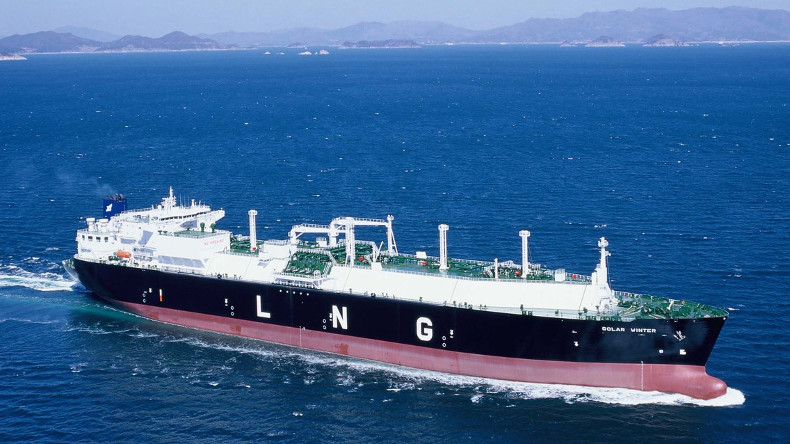
New Silk Road Monitor LNG Weekly Must-Reads – April 9-16
The Five Must-Read Stories on the Global LNG Market This Week – April 9-16
Egypt To Nearly Double LNG Export Capacity by 2019
Egypt will nearly double its liquefied natural gas export capacity to 2 billion cubic feet per day by the end of 2019, and also plans to collaborate with Saudi Arabia in exploring hydrocarbon reserves in the Red Sea, reports the Abu Dhabi-based The National.
Russia Sees Arctic LNG as Key to Greater Energy Dominance
Almost 1,500 miles from Moscow, the tiny port of Sabetta nestles in a desolate Russian Arctic peninsula. A former outpost for Soviet geologists, it’s now the site of Russia’s most ambitious liquefied natural gas project, operated by a company that only entered the market just over a year ago.
Several times a week, a giant tanker leaves this remote place carrying the super-chilled fuel to buyers in Europe and Asia. It’s not the only LNG plant beyond the Arctic Circle, but it’s by far the largest.
Novatek PJSC, the main shareholder of the Yamal LNG plant, says plans for further projects will transform Russia into one of the biggest exporters of the fuel within a decade, Bloomberg reports.
World’s Top LNG Buyer Posts an Order From LNG Canada
Japan’s JERA, the world’s top buyer of liquefied natural gas, on Tuesday said it had signed an agreement with a Mitsubishi Corp unit to buy up to 16 cargoes, or 1.2 million tonnes per annum (mtpa), of LNG from the LNG Canada project, Reuters reports.
China Set To Build the World’s Largest LNG Carrier
China’s Hudong-Zhonghua shipyard and classification society DNV GL have agreed a joint development project for a new 270,000 cubic meter LNG carrier – the largest ever ship of this type, Maritime Executive reports.
Saudi Aramco Eyes First Ever LNG Sale With Overture to Pakistan
The world’s largest oil company is moving into the world of liquefied natural gas, offering to supply Pakistan with cargoes of the fuel even though it doesn’t produce any, according to a Pakistan government official.
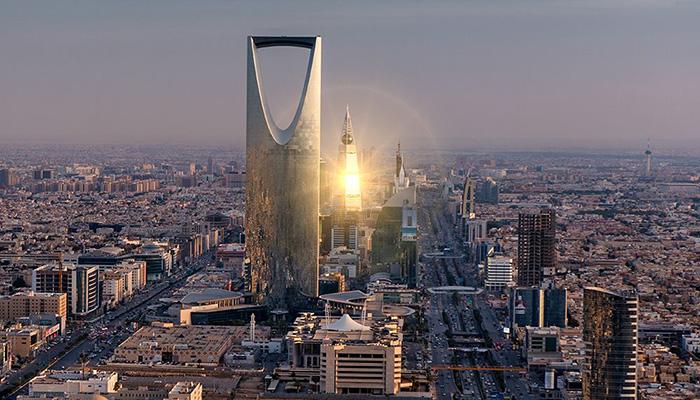
New Silk Road Weekly Saudi Arabia Chronicle – April 8-15
The New Silk Road Weekly Saudi Arabia Chronicle
A compendium of the key numbers, quotes, and stories reflecting the economy of Saudi Arabia, curated from global and domestic news sources.
Sources: News Agencies, Financial Times, Bloomberg, CNBC, Reuters, Arab News, Saudi Gazette, The National
Key Numbers
$100 Billion+
Demand for Saudi Aramco’s inaugural international bond has skyrocketed to some $100 billion by mid-Tuesday, according to news reports. This represents an oversubscription of ten times the original bond offering, reflecting intense international investor interest in the world’s largest oil company.
1.8%
The IMF forecast for Saudi Arabia’s economic growth in 2019, announced in the latest World Economic Outlook. This marks a downward revision of its previous forecast of 2.4%, in line with a broader global downward revision in growth.
$71.27
The international benchmark Brent crude futures price as of Tuesday, April 8. This marks the highest Brent price since November 2018.
$111 Billion
Saudi Aramco’s net income for 2018.
12.2 Million bpd
US Crude oil production in March, a global record. Additionally, the US exported more than 3 million barrels per day, a US record. The U.S has increasingly become a competitor in global oil markets and new US shale discoveries exert downward pressure on global oil prices.
$69.1 Billion
The amount Saudi Aramco agreed to pay to buy a 70% stake in state petrochemicals firm Saudi Basic Industries Corporation (SABIC) from Saudi Arabia’s Public Investment Fund (PIF).
SG 33 and SG 34
The new flight listing for the daily SpiceJet flight from Hyderabad to Jeddah (33) and Jeddah to Hyderabad (34), marking the first Indian budget carrier flying direct to Saudi Arabia. On April 20, SpiceJet will add a new daily flight between Jeddah and Kozhikode.
56.8
Saudi Arabia’s non-oil private sector witnessed strong growth in March as evidenced by a high reading on a monthly purchasing manager’s index compiled by Emirates NBD Bank. The Dubai-based lender’s Saudi Arabia Purchasing Managers’ Index – a reflection of operating conditions in the non-oil private sector economy – climbed to 56.8 in March. A reading above 50 shows expansion, while below 50 indicates contraction. Emirates NBD said the current figure was the highest since December 2017
Quotable Notable
On reports that Saudi Arabia would abandon the dollar in oil sales
“Recent reports claiming that Saudi Arabia is threatening to sell its oil in currencies other than the dollar are inaccurate and do not reflect Saudi Arabia’s position on the matter.”
“The Kingdom has been trading its oil in dollars for decades and that has served well its financing and monetary needs. Furthermore, the Kingdom remains committed to be a stabilizing force to energy markets and does not want its key priority to be out at risk, including changes to the financial terms of oil trading relationships around the world.” Khalid Al-Falih, Minister of Energy, Saudi Arabia (Editor’s note: The rumors began to circulate as the U.S Congress debates “NOPEC” legislation targeting the global oil grouping led by Saudi Arabia)
UAE Energy Minister on oil sales in non-dollar terms
“The trading in the US dollar is something that you don’t change overnight. I think that [has been] a norm in the industry for years and years so let’s not jump into some of those ideas … Opec did not claim that they will change the currency in trading.” UAE Minister of Energy and Industry Suhail Al Mazrouei speaking on the sidelines of the Middle East Petroleum & Gas Conference (MPGC) in Dubai.
On Saudi Arabia’s strong PMI reading
“The average PMI reading for the first quarter of 2019 was 56.5, indicating the strongest quarterly expansion in the non-oil private sector since the fourth quarter 2017.” Khatija Haque, head of Mena research at Emirates NBD.
Global Media on the Saudi Aramco Bond Sale
Bloomberg
The Aramco deal is one of the most hotly anticipated debt deals of the year, marking the first time the Saudi oil giant has tapped the international bond market, reports Bloomberg. When Qatar, a rival Middle East nation, sold $12 billion in bonds earlier this year, it got a record $50 billion in orders, evidence of investor appetite for debt of rich, oil-producing nations.
The deal is largely seen as Plan B to raise money for the country’s economic agenda after the initial public offering of Aramco, slated for 2018, was postponed until at least 2021. In effect, Saudi Crown Prince Mohammed bin Salman is using the company’s pristine balance sheet to finance his ambitions.
CNBC
Aramco, the world’s top oil producer, earlier this month received an “A+” rating from Fitch and an “A1″ rating from Moody’s in its first ever credit ratings, following 2018 earnings that dwarfed those of international oil majors, reports CNBC.
Saudi Arabia has already seen formidable success in its recent tapping of the bond market: It issued $7.5 billion in sovereign bonds in January which drew an impressive $27 billion in orders. Saudi Arabia has “A1” and “A+” ratings from agencies Moody’s and Fitch, respectively, a sign of reliability and low risk for investors.
The Financial Times
Investors have been lured in by the disclosure of hefty profits for the oil company, backed by a high, “single-A” credit rating, the FT reports.
Aramco has told investors that credit rating agency Moody’s would have given it a top-notch triple-A credit rating, if it was not for the close links to the Saudi state. Saudi Aramco provided the Saudi government with 63 per cent of its revenues in 2017 but the government still runs a deficit, and some investors fear further cash could be diverted away from the company, to the detriment of bondholders.
“It is a rare issuer and if you look at the pure credit of the issuer it is extremely attractive,” said Tim Jagger, head of emerging-market debt at Columbia Threadneedle. “But the fate of this company is inextricably tied to the fate of the sovereign and we know the sovereign is running a large fiscal deficit.”
The oil company has been meeting fund managers behind the scenes for several months to lay the groundwork for this debut bond sale. It even enlisted the help of veteran investor Mohamed El-Erian, chief economic adviser at Allianz and a former chief executive of bond giant Pimco, to consult on “technical aspects” of the $10bn offering.
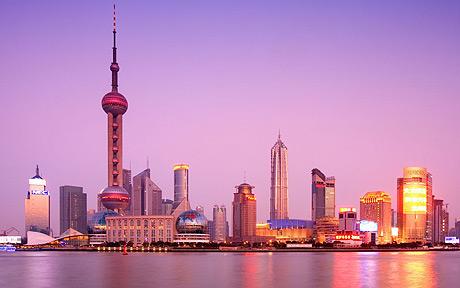
New Silk Road Weekly China Chronicle – April 8-15
New Silk Road Weekly China Chronicle
A compendium of the key numbers, quotes, and stories shaping China, curated from global and domestic news sources.
Sources: News Agencies, Shanghai Daily, China Daily, Beijing Review
Key Numbers
2.6%
The World Trade Organization revised downward its projections for trade growth for 2019. Originally, it forecast 3.7% growth. In 2018, its initial forecast of 4.4% trade growth fell to an actual trade growth of 3%.
$3.099 trillion
China foreign exchange reserves as noted in March, the highest since August 2018. This marks the fifth straight month of growth in China foreign exchange reserves, a signal that hopes remain high that a trade deal will ultimately be reached between the U.S and China.
20%
China stock market rally as of April 8, 2019. In the beginning of April, Chinese stocks notched their best performance in a year. The CSI 300 index, composed of major companies listed in Shanghai and Shenzhen, has reached its highest level since March 2018.
22%
The percentage of gas imports provided to China by Qatar over the past decade
6.3%
The latest Asian Development Outlook 2019, ADB’s flagship economic report, said China’s economy is forecast to grow 6.3 percent in 2019 and 6.1 percent in 2020. The ADB report noted that consumption was the main driver of growth in 2018, contributing 5 percentage points, underscoring China’s move away from investment-led growth toward a more sustainable consumption-driven model.
29
The number of unicorns – start-up companies with a valuation of more than $1 billion – that have emerged in Beijing since 2012, according to CB Insights. Shanghai, on the other hand, accounts for 11 unicorns in that same time period. Over the past six years, Beijing’s startup companies alone have received $72 billion in funding, ranking the second highest in the world.
Notable Quotable
On the threat of U.S tariffs on auto imports
“US-China trade is about 3 percent of global trade. Automobile trade globally is about 8 percent of global trade. So you can imagine that the impact of automobile tariffs is going to be bigger than the impact of the US-China trade conflict.
“I think it’s pretty clear that any automobile tariff would likely have bigger knock-on effects through the global economy than what we see from the US-China conflict.” WTO Chief Economist Robert Koopman
On growth in China
“Growth [in China] remains remarkably robust, underpinned by resurgent global demand, stimulus-boosted infrastructure spending, and a deleveraging program that remains more honored in the breach than the observance.” Tom Orlik, Bloomberg chief Asia economist
On climate change and natural gas
“There is no realistic achievable plan to address the climate change problem that doesn’t involve natural gas.” Mike Wirth, Chairman and CEO, Chevron, speaking at the 19th International Conference & Exhibition on Liquefied Natural Gas in Shanghai
